Brian Corbett: Harbor Chart Comparisons
-
- Goat Island

-
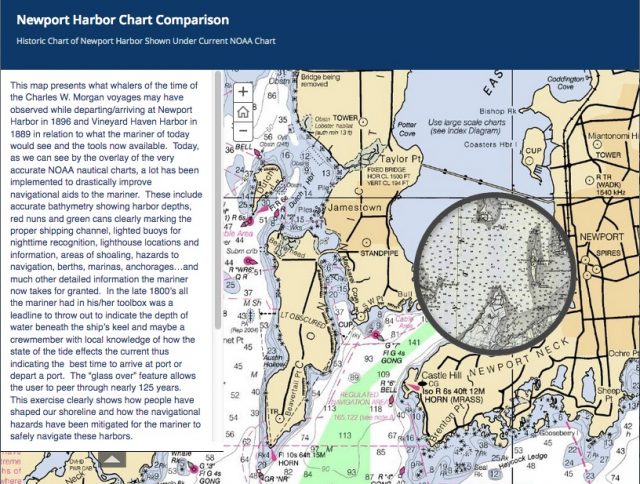
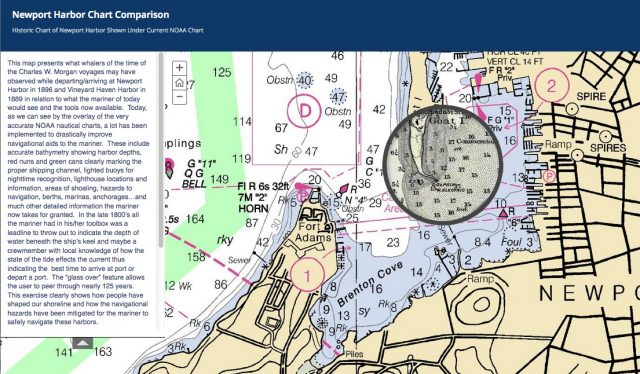
- Newport Harbor

-
- Oak Bluffs

-
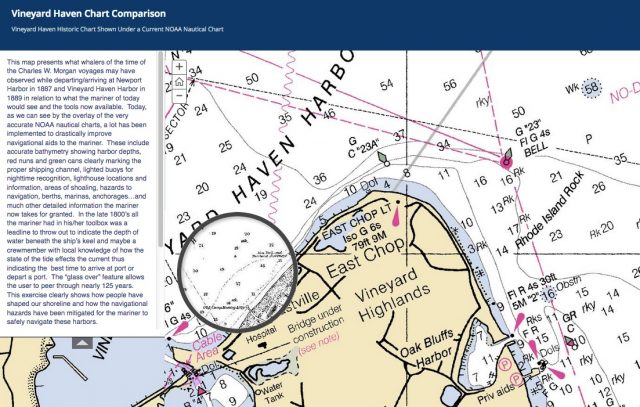
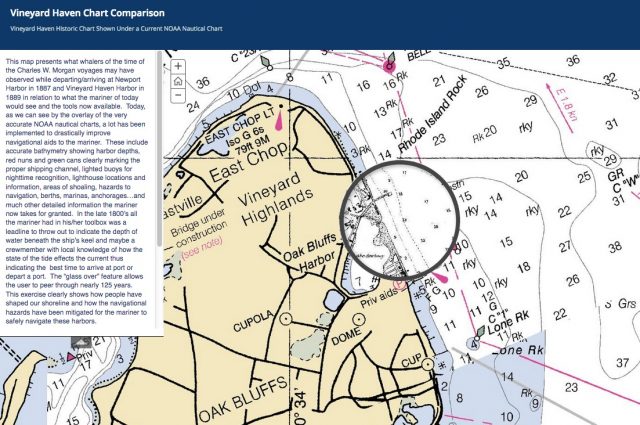
- Vineyard Haven

These maps present what whalers of the time of the Charles W. Morgan voyages may have observed while departing/arriving at Newport Harbor in 1896 and Vineyard Haven Harbor in 1889 in relation to what the mariner of today would see and the tools now available. Today, as we can see by the overlay of the very accurate NOAA nautical charts, a lot has been implemented to drastically improve navigational aids to the mariner. These include accurate bathymetry showing harbor depths, red nuns and green cans clearly marking the proper shipping channel, lighted buoys for nighttime recognition, lighthouse locations and information, areas of shoaling, hazards to navigation, berths, marinas, anchorages…and much other detailed information the mariner now takes for granted. In the late 1800’s all the mariner had in his/her toolbox was a leadline to throw out to indicate the depth of water beneath the ship’s keel and maybe a crew member with local knowledge of how the state of the tide effects the current thus indicating the best time to arrive at port or depart a port. The “glass over” feature allows the user to peer through nearly 125 years. This exercise clearly shows how people have shaped our shoreline and how the navigational hazards have been mitigated for the mariner to safely navigate these harbors.
The whalers of Morgan’s day utilized sextants and natural satellites of planets, stars, moon, sun etc. to find longitude and navigate their ways across vast oceans. Today’s mariner crosses oceans using intelligent NOAA nautical charts, like the ones presented here, linked to GPS and calculating similar angles and distant measurements but performed with sophisticated space age satellites in geo-stationary orbits circling around the earth.